top of page


CONVOY
TOOLS
Figma, Photoshop, Illustrator, 3D Printing, Arduino, Rhinoceros, KeyShot.
MY ROLE
UX/UI Design, Wearable Device Design, UX Research.
TEAM
Product Designer, UX Researcher
DURATION
August 2019 - December 2019
Overview

Background
Background
01. Background
Literature Review and Competitive Analysis methods were selected to explore the problem space.
Problem
In the United States, 45% of women report they do not feel safe walking alone at night.
Socioeconomic status, ethnicity, and age can increase the levels of anxiety experienced when walking alone at night.
Women tend to arrange their plans to occur in daylight, walk different routes, and do not attend events at night to stay safe.
They feel the urge to let their friends and family know when they arrived at the desired location safely.
Competitive Analysis
Despite the high statistics and adverse effects of this problem, a robust product or a system does not currently exist. 3 crucial issues with these products are defined:
1
Reliability
Lack of feedback, state of the product, and communication.
2
Complexity
The interaction is either takes a lot of time or the language is too complex to understand.
3
Error Tolerance
Once the emergency state is activated it can't be canceled.
User Research
02. User Research
In order to understand our user group better, we have conducted various user research methods such as surveys and semi-structured interviews + follow-up questionnaires.
User Research
Surveys
To understand the trend of what our users make them feel safe, we distributed a survey. This helped us to categorize certain behaviors and perceptions towards walking alone as women.
36 participants
~ 15 mins
18 questions
Semi-Structured Interviews
Questions were created before the sessions. This session helped us to understand what makes participants feel safe or not and their behaviors regarding walking alone at night.
9 female participants
~ 1 hour
20 defined questions


Participants's own handwritings about what makes them safe or not

INITIAL USER RESEARCH INSIGHTS
1
Statements of our participants bolstered the information about not feeling safe walking at night.
2
Quality of the environment (maintenance, lumination, etc.) that provides safety changes according to the individual.
3
In contrast to our assumptions, users don't want to carry items or weapons in their hands and don't prefer to be distracted by their phones.
Understanding Data
Understanding Data
03. Understanding Data
To understand our data, we created an Affinity Map with the data obtained from user research activities.

Pain Points
Pain Points
We found 19 major pain points that all were unique in their situation, contexts, and relevant to the original problem. We decided that there were six insights that we wanted to concentrate on moving forward.
01
Being unfamiliar with an area makes women unsafe
02
Being able to connect with other people helps our users to feel safe
03
People don't reach out to the police when they are uncertain that they are in danger
04
Users want to reach authentic crime information of a neighborhood
05
Users want to know about the different qualities of an area which makes them feel safe (ex. illumination)
06
People prefer to be closer to the areas that are more crowded
Understanding Users
Understanding Usersta
04. Understanding Users
By creating user personas, empathy maps, journey maps, and task analysis we aimed to go deeper into their experiences, thoughts, and emotions by giving our users "a voice".
Examples of Activities


Surface Book - 2

1/4
OUR USERS

I have been living here for a long time but I still don't know the real criminal activity of neighborhoods.

I am new to the city and I don't know safe areas. This makes me feel anxious when I walk alone at night
Ideation
05. Ideation
To come up with a wide range of ideas, we engaged in an informed brainstorming session and creativity/feasibility chart keeping our pain points in mind.
Ideation


1/3
Potential Solutions
After our sessions, we selected three possible ideas then created the low-fi paper prototypes and tested them with our users.


1
Transportation App
2
Walking Buddy
3
Crime Data & Wearable
Ability to rent bicycle, scooter, or car rental when users feel uncomfortable.
Users feel more comfortable when they have company while walking so users know other people nearby that are walking to a similar destination and users can join them.
Users want to know the real crime data hence this solution provides data from real police reports. According to that, the app and the wearable suggest safe routes.
😊
Ease of use because of the familiarity with transportation apps.
😊
Ease of use because of the familiarity with location-based apps.
😊
No need to look at the phone.
Users trust the app because it relies on real crime data.
😔
The phone is distracting.
😔
Only focuses on the pre-travel.
😔
The features of environments that users find important, change.

Final Solution
FINAL SOLUTION
An app and a wearable device that suggests safe routes according to crime data.
The wearable device guides users to the desired destination by using voice and haptic interaction.
Users will also be able to search for information about neighborhoods and join communities in order to receive the community's latest crime and news stories.
Design
06. Iteration
Iteration
We had two iterations to improve our designs according to the actual user feedback.
For iteration-1, digital low-fi wireframes were created and tested with users by using think-a-loud and cognitive walk-through.
For the wearable, a participatory design session was conducted, and the 3D model was created and tested with users.

ITERATION-1 FEEDBACK
Wireframe Feedback
😊
Users loved the idea of knowing crime data and real-time news of neighborhoods. Also, onboarding screens were helpful to adjust them to the design.
😔
Users needed more information about neighborhoods like the pictures of them. They thought that this will help them to feel familiar with the area.

Wearable Feedback
Users performed tasks and After Scenario Questionnaire and questions probing users about the comfort, understandability, and learnability of the wearable administered. Task completion success noted.
😊
Users stated that fingers, wrists, and forearms are the best places to wear a device.
Furthermore, they liked the idea of being guided with haptic interaction.
The turning motion was an intuitive interaction.
😔
The tutorial was needed for users to understand how the wearable works and also help them to orient to the system.


Final Design
07. Final Design
For the Final Design, we revised our design and created digital high-fi wireframes.
For the wearable, various designs are modeled and the final design is selected. Haptic interaction tests were conducted to test the feedback method.
.png)
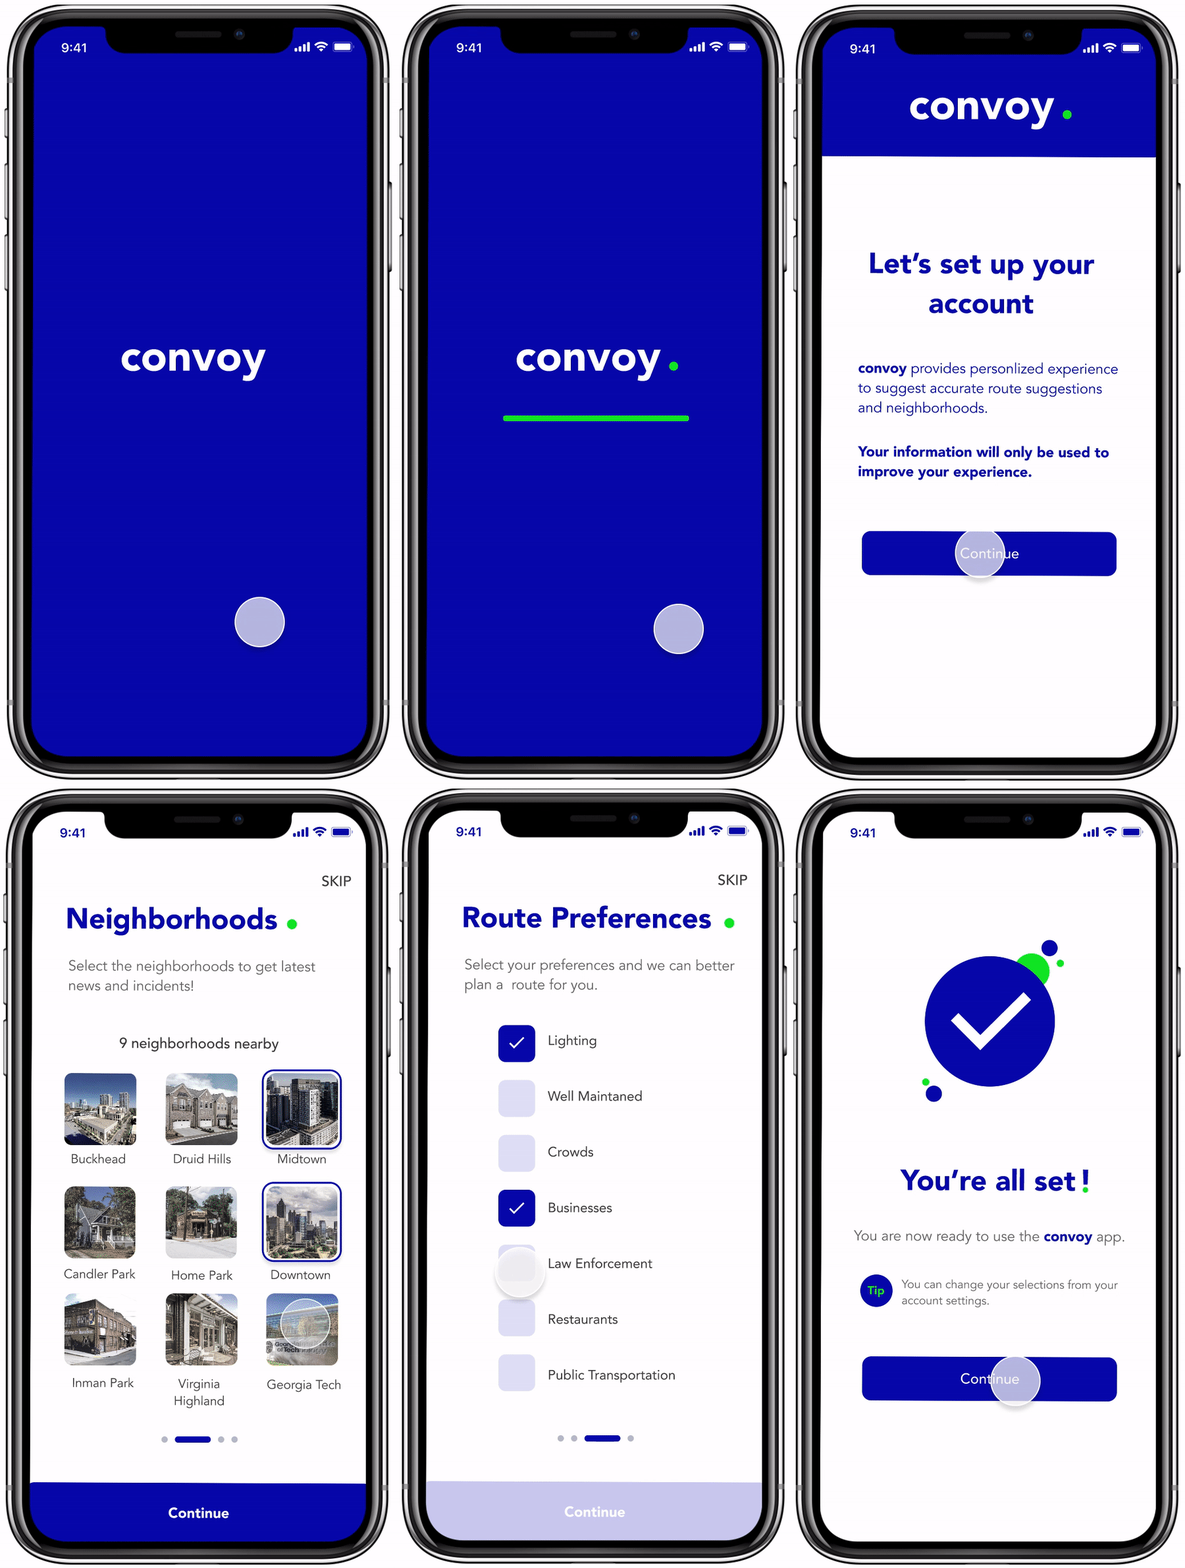
Onboarding
Research-design link
Users feel comfortable in different quality of environments hence thanks to the questions on the onboarding, the system offers a personalized experience.
By selecting the neighborhoods users can reach their real-time news, crime data, and the overall score.
Users can select qualities that are important for them to evaluate the safety of an area (ex. light, maintenance)
Users can import the contacts that they want to reach in an emergency situation.

Crime Data & Neighborhood
Research-design link
Familiarity is a crucial part of feeling safe. By pictures and data of neighborhoods, we aimed to familiarize users.
Users want to reach authentic crime information of a neighborhood. This information is provided by using data visualization.
Various information can be found on each neighborhood page such as overall score, street view, and news.
The majority of the "overall score" is composed of police reports and a minor percentage is provided from our user ratings.
The crime graphs designed to be easy to understand and under each table source is provided to increase the credibility


Real Time News
Research-design link
Users want to reach crime information of a neighborhood and familiarize themselves with the area. This is also achieved by providing ongoing stories and news.
Users can see different stories of the neighborhoods.
Furthermore, emergency situations and ongoing instances' progress are provided to our users

Safe Routes
Convoy provides multiple safe routes that users can choose from. Each route has different qualities and ratings considering the overall score of an area.
When convoy + is paired with the app it gives haptic feedback to users to navigate safely.

Wearable Device Screens
Research-design link
Users don't want to be distracted with their phone hence safe routes can be uploaded to their wearable.
The safe route can be uploaded to the device.
Convoy + navigate them by using various stimuli; sound, vibration, and lights
By using the wearable device or the app users can contact the people who are assigned to different alert modes.
If an emergency situation happens close to their location, users will be informed and the system will re-route the safe route.
Battery
Alarm state
1


Wearable Device

Battery


Device state
1
0 degree State
2
90 degree State
3
180 degree State
Red Alert
Passive
Yellow Alert
Indicated by the red light.
Location of the users shared with red contacts and the police.
Indicated by the green light.
The wearable is ready.
Alerts are not activated.
Indicated by the yellow light.
Location of the users shared with yellow contacts
Research-design link
Users want to be connected with their loved ones. Wearable allows them to connect with them in an easy way. Also, in case one hand is occupied wearable can be operated with one hand.
Usability Testing
Usability Testing
07. Usability Testing
To evaluate if the outcomes match our aims, expert-based testing, and user-based testing were conducted by using interactive prototypes.
Haptic Interaction Test
Arduino and vibration motors were used to simulate the vibration. Possible haptic communication methods are tested.


Wearable Feedback
😊
Indication of turning right, two subsequent vibrations, and for turning left, one vibration was successful. Users thought that it is nice for navigating without looking at the phone.
😔
Users stated that haptic implementation to phones can achieve the same intention as wearable. Also, even though tutorials provided images and short descriptions of gestures of convoy+ they were still confused. The turning motion for activating the alerts was too easy.
User Based + Expert Based Testing
Prior to user-based testing, we have conducted a Design Critique with an expert and asked him to analyze our system and give feedback on how much the current design meets our objectives.
During our User-Based testing, we asked participants to complete benchmark tasks. During their performance, we measured: Task success(Yes/No), task completion time, and the number of clicks.
4 participants
~ 1 hour
20 tasks


Mobile App Feedback
Avg. No.Clicks
2.2
Avg. Sec. per Task
7.2
SUS Score
77/100
😊
Users found the UI simple and easy to use. Also, the personalized experience was valuable for them. They were excited about the app and object combo.
😔
Users needed a short tutorial. Even though they were excited about the wearable they needed more information about how to use it.
Reflection
Background
07. Reflection
"Close enough" contexts are great for getting insights.
Because of the technical limitations, we had to come up with alternative methods to test our design. Even though tests didn't take place in the real context, they were good enough to get important insights.
Users are the best teachers
Our users helped us to investigate the problem deeper in this way we gained valuable insights and some of our predictions actually undermined that led to a better design.
Improvement never stops
After a year later, I did an evaluation of Convoy and realized a space for improvement. I revised the UX and UI of the design.
bottom of page
.png)